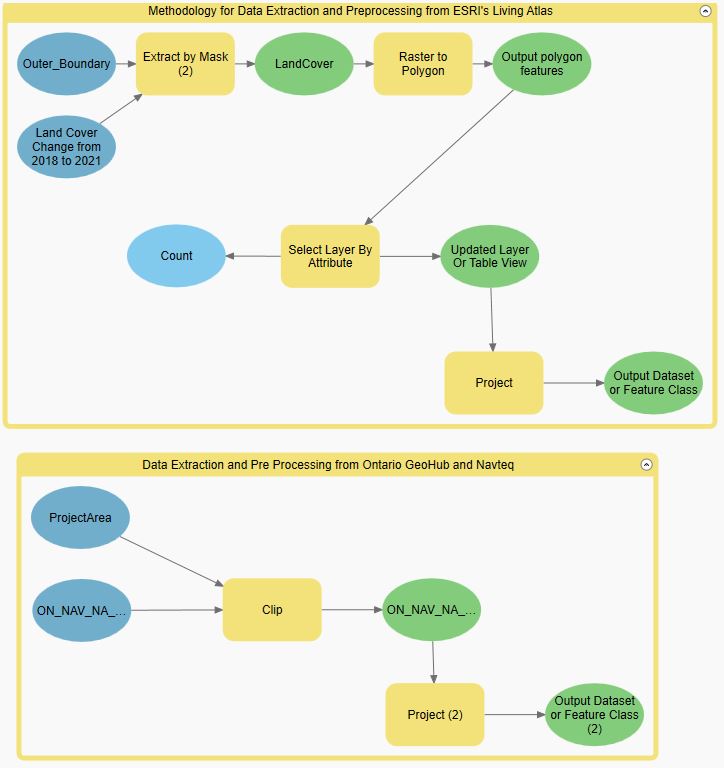
Most of our data are downloaded from Ontario GeoHub and ESRI Living Atlas. The first we do is to clip them based on our defined study area. Then we transform them into the same projection. All layers and outputs are stored in the Geodatabase.
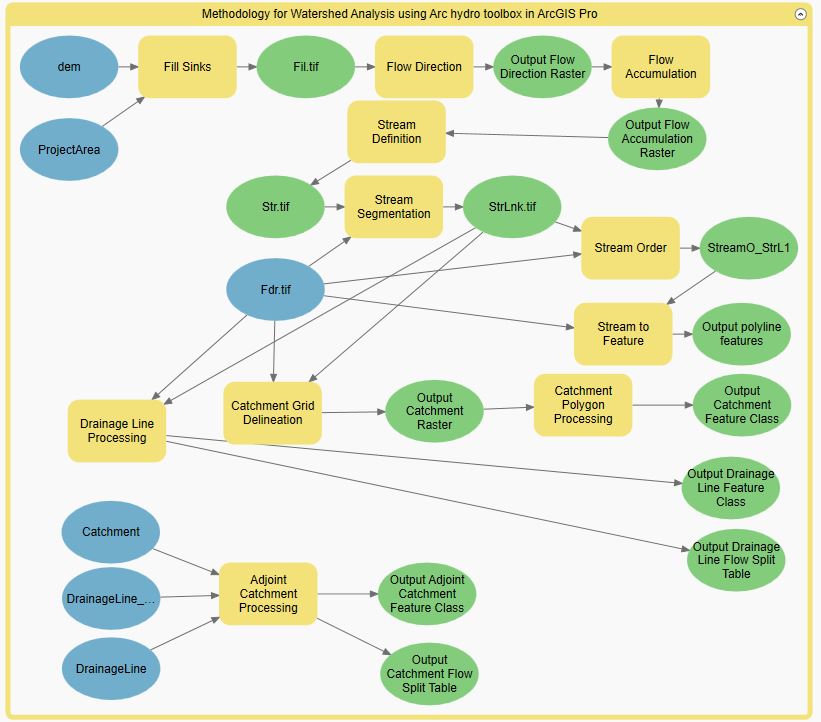
Below are the tools we use to analyze and determine the watershed boundary and the stream order in ArcGIS Pro.
Fill sinks tool removes depressions or sinks in a digital elevation model (DEM) by filling them with neighboring elevation values. This process is important in watershed analysis because depressions can cause inaccuracies in the calculation of flow direction and accumulation, which can affect the delineation of watersheds and the identification of drainage patterns.
Flow Direction tool identifies the direction that water flows across a digital elevation model (DEM) surface. This information is used to create a flow accumulation raster, which shows the number of cells that contribute flow to each cell in the DEM. The flow accumulation raster is then used to create a stream network, which is the basis for delineating watersheds.
Flow accumulation tool calculates the accumulated flow of water through each cell in a digital elevation model (DEM). This information is used to identify the flow paths and streams in a landscape, which are then used to delineate watersheds.
Stream Definition tool is used to identify the location of streams within a watershed. It does this by analyzing the flow direction and accumulation of water in the area, and identifying areas where the water flow is concentrated enough to form a stream.
Stream Segmentation tool is used to divide a stream network into segments based on certain criteria such as stream order, flow accumulation, or slope. This tool is useful for analyzing and managing streams and watersheds.
Stream Order tool is used to assign a hierarchical order to streams or rivers within a watershed based on their relative position in the network. This tool is commonly used in watershed analysis to understand the flow and connectivity of water bodies within a given area. The stream order is determined based on the number of tributaries that contribute to a given stream segment, with higher order streams having more tributaries and a larger drainage area.
Stream to Feature tool converts a raster stream network into a vector feature class. This tool is often used in hydrological analysis to identify and map the flow of water in a given area.
Catchment Grid Delineation tool is used to generate a grid-based representation of the catchment areas or drainage basins within a given study area. The tool uses a digital elevation model (DEM) as input to determine the flow direction and accumulation patterns of water across the landscape.
Catchment Polygon Processing converts a catchment GRID it into a catchment polygon Feature.
Adjoint Catchment Processing tool is used to calculate the upstream contributing area for each cell in a digital elevation model (DEM). This tool is used to identify the areas that contribute water to a particular point in the watershed.
Drainage Point Processing in ArcHydro is a feature extraction tool used in ArcGIS Pro for creating hydrologic features such as stream networks, catchments, and drainage points. The tool extracts the lowest point in each catchment and generates unique ID numbers for each drainage point. The drainage point processing tool is useful in identifying the location of natural drainage pathways and understanding the flow of water in a region. The drainage points that are extracted by this tool can be used as a starting point for further analysis and modeling of the hydrological system in the area. The tool helps in identifying the flow direction, flow accumulation, and stream order of a catchment. In summary, the Drainage Point Processing tool in ArcHydro is an essential tool for anyone working with hydrological data and conducting analyses related to water flow and movement.
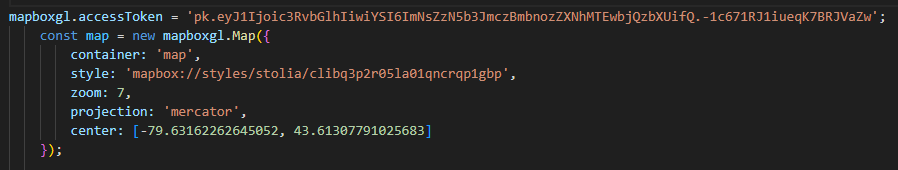
mapbox allows us to create, edit and customize basemap styles, colours, fonts, etc., which is why we choose to use it to present the results of our analysis.Similar to using the Esri Leaflet, we first import the styles we want to display by adding token and URL links. Next we decide on the center point of the map and the zoom level.
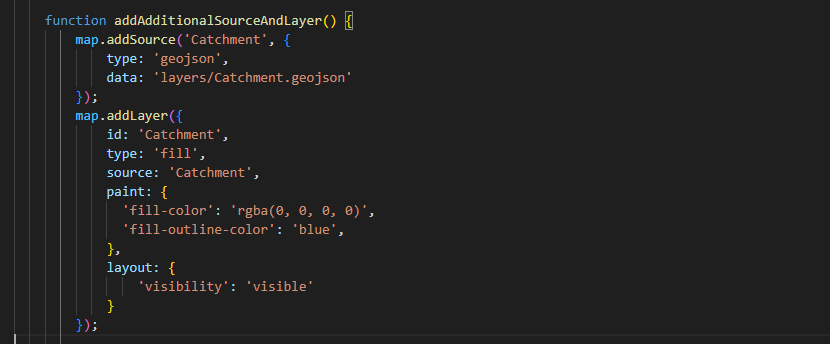
Before importing layers to the web map, we need to make sure that the layers are in a compatible format. In this project, we decide to convert all vector layers into geojson format. After importing a layer, a unique ID has to be assigned. In the screenshot below, for example, I imported a catchment layer and assigned an ID to it (I simply call it "Catchment"). For visualization purposes, layers' type (such as fill and line) has to be decided. Then, we can customize our layers by changing fill colour, line colour, thickness and transparency, etc.
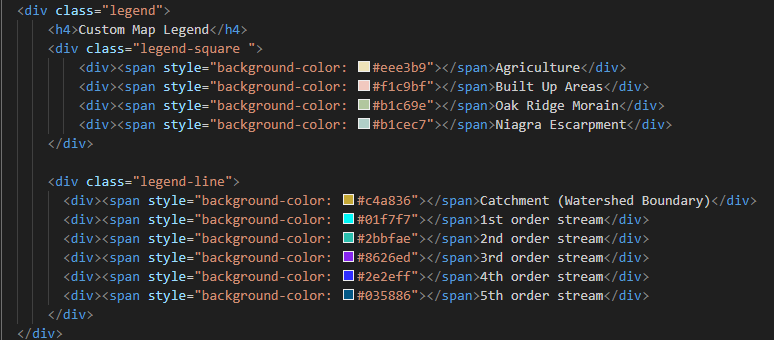
Legends are not automatically generated in Mapbox. A div class is created to contain our legend, and the style and position of the legend container can be customized by editing the CSS properties. For more information on how to add legends visit mapbox tutorial.
The map visualization was meticulously crafted utilizing Mapbox Studio, a comprehensive platform for map design and customization. To achieve optimal visual clarity and aesthetic appeal, two distinct map styles were carefully chosen for this particular project. Firstly, the Monochrome map style was selected to enhance the visualization process by focusing on essential elements while minimizing distractions. Secondly, the Satellite Streets map style was specifically requested by the clients to provide a detailed representation of the geographical features.
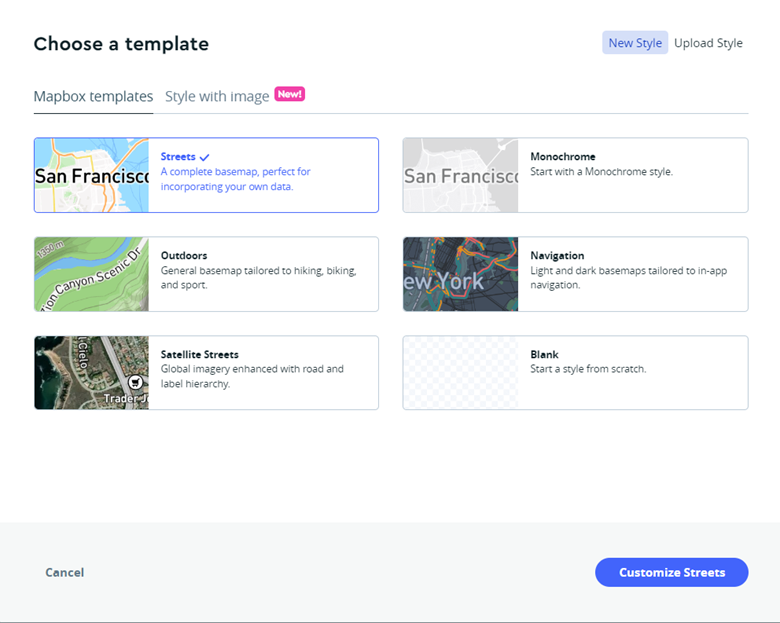
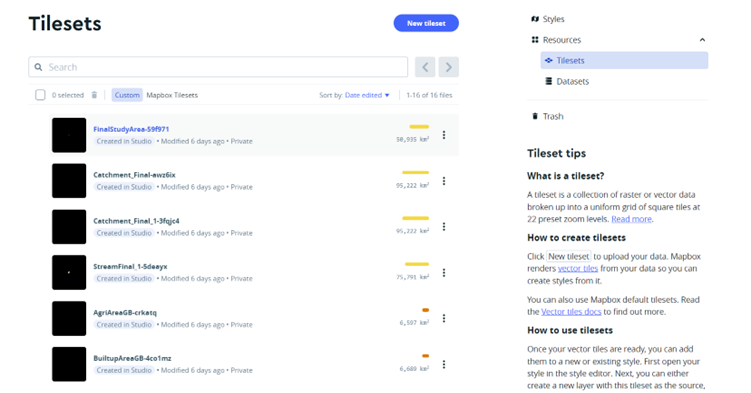
The selection of these map styles was facilitated through the New Style tab within Mapbox Studio, enabling the exploration and assessment of various design options. Once the desired styles were identified, the next step involved uploading the zipped shapefiles of the required layers to the map via the tileset tab. These shapefiles contain geospatial data representing different aspects of the map, such as boundaries, waterways, and landmarks.
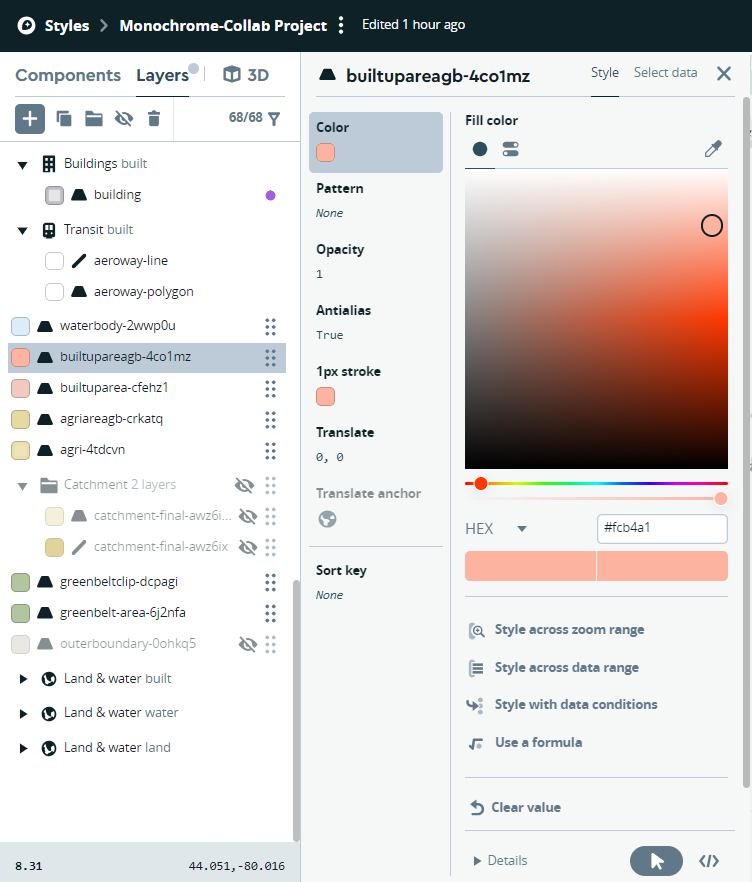
To adhere to cartographic standards and ensure effective communication of information, the layers within the map were meticulously assigned appropriate colors. This process involved thoughtful consideration of established cartographic principles, including color harmonization, legibility, and visual hierarchy. By adhering to these standards, the resulting map conveys data and insights in a clear and visually appealing manner.
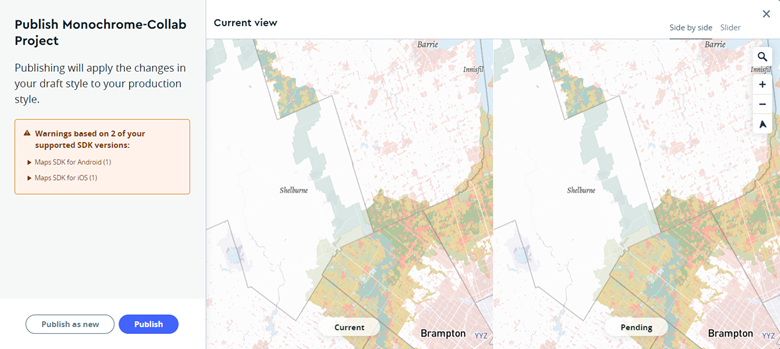
Once the map customization was complete and deemed satisfactory, it was published to make it accessible for others. The map was embedded on a website using the provided URL, allowing viewers to interact with and explore the customized map. This publication step ensured that the map could be shared and utilized as intended.
Overall, the selection of Mapbox Studio for the visualization process advanced the capabilities of creating a map that harmonizes both functional and aesthetic requirements. By combining the Monochrome and Satellite Streets map styles, and meticulously assigning colors to the layers, the final product reflects a professional approach that aligns with industry standards and meets the expectations of the clients.