
Preface
None of us have used Leaflet before this semester, but we are still able to display our solution and show something to Shawn after a long struggle. We sincerely believe that you too can learn how to use Leaflet (even if you don't know anything like us) and create a solution website that is more exceptional than ours!
Ming
11 April, 2023
Data Collection
The data was collected through multiple sources. the feautre layer for the route was created by Suruchi, while Rajeev published the layer in ArcGIS Online to be used for the final map. The point coordinates along the route was created by Meet from Google maps and all the Images used in the website were clicked by Meet on his Trip to Ladakh in July 2022.
Display A Basemap
The first thing we did was to enable access to the core mapping functionality by going to the Leaflet site and copying the latest release code.
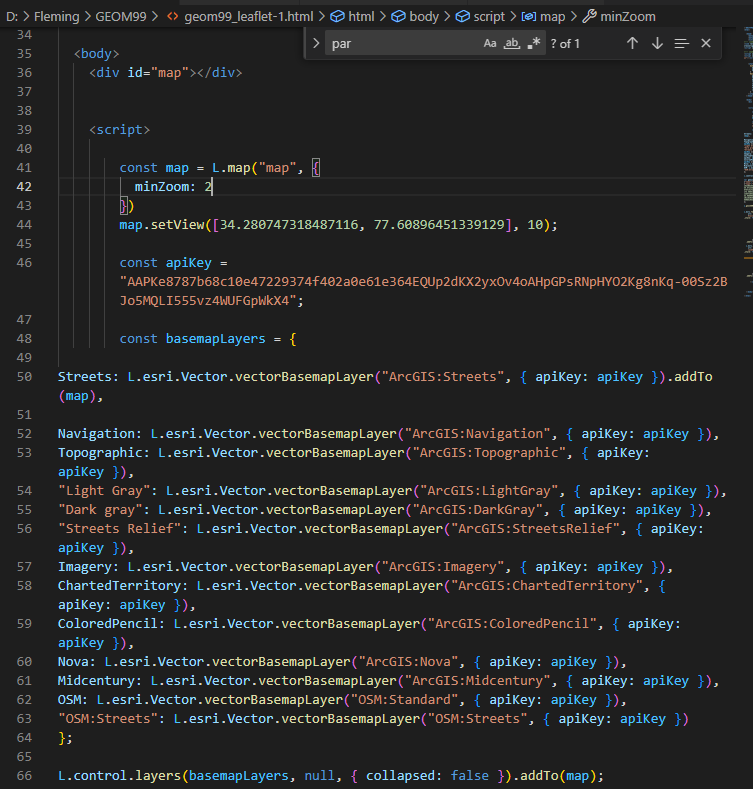
Next, we try to display a basemap.The code is shown on the left. We started by selecting and entering a coordinate on the map and setting a zoom level.The ArcGIS Developers website provides many examples of base layers, we copy all the example codes (just for fun) and we eventually selected three base layers that best suited our problem (streets, naviagtion and topographic).
Add Feature Layers (GeoJSON)
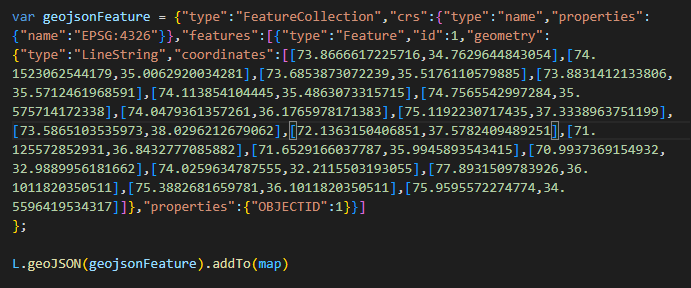
We next tried something a little more difficult, which is importing our layers. Since Leaflet supports various forms of importing feature layers such as csv, geojson, shapfile etc. We first try displaying a random polyline in geojson format. We notice that although this is a very simple line segment, the code appears redundant mainly because of the large amount of coordinate data.
Add & Customize Feature Layers (AGOL Hosted Layers)
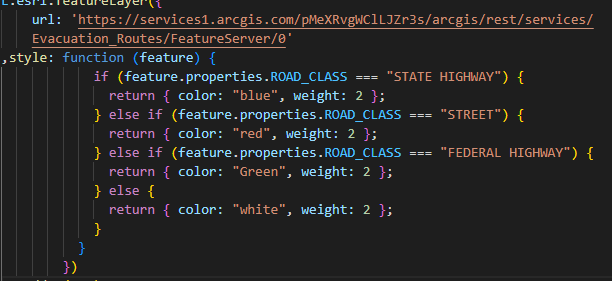
Then we decide to import our data from a hosted feature layer. Given that I had already published a feature layer in another class, I decided to import it. I first made sure that the layer was set to be visible to the public. I then direclty copy and paste the layer url (note it's the layer URL)
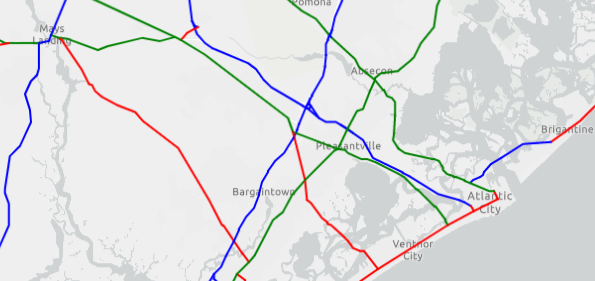
Next I notice that the symbology is not retained after the layers are imported into Leaflet. The ArcGIS Developers website provides really detailed examples of how to change the polygons or line symbols. I choose to assign colous to differnt type of roads based on attributes, (thickness can also be changed by modifying weight value here).
Add & Customize Pop-ups
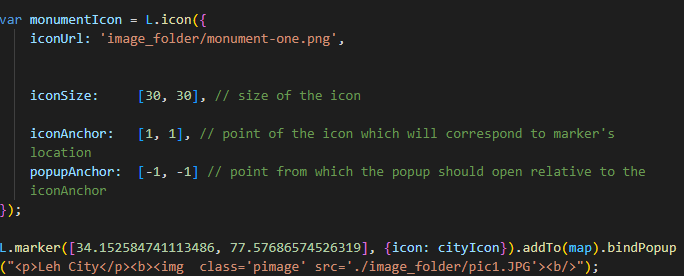
To make our map more pleasing, we choose to use our iamges instead of the default icon. We first creat a icon class and give it a unique name, for example the icon in the screenshot is called monument, and we link it to the image we want to use from our images folder. When we display our markers to the map, we can tell the Leaflet to use this icon by using code: "{icon: [name of the icon]}".
